Please note that this article is superseded by more research done here: Stereophile and Equivalent Peak Dissipation Resistance.
We leave the original article below for history, and due to existing links, but we encourage you to read the article, above, first.
What follows below was naive and needed more research. In particular, I no longer believe EPDR helps the average audiophile do anything.
Original article:
Anyone who has spent time looking at Stereophile speaker reviews has become familiar with speaker phase and amplitude plots. The idea behind showing a reader this is to let them know how difficult any given speaker might be to drive. Whether a lightweight amp or big honking monoblock will be needed.
Here's an Example of a very well behaved 2-way speaker from Totem Acoustics:
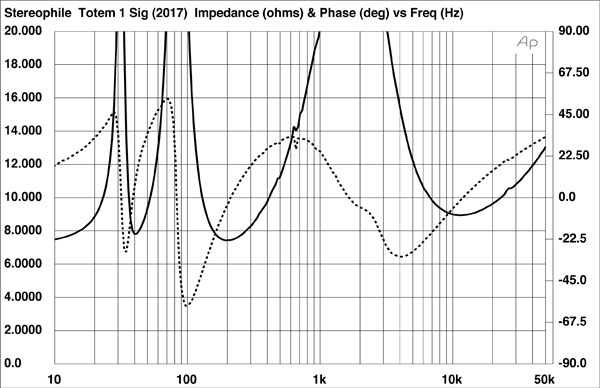
We can see the impedance never drops below 7 Ohms and the phase angle is for the most part pretty well behaved.
In 2007 Stereophile writer Keith Howard introduced the concept of Equivalent Peak Dissipation Resistance (EPDR). EPDR is a little convoluted. The goal is to mathematically combine phase angle and impedance to come up with a new number expressing how hard the speaker will really be for an amplifier to maintain a consistent output across all frequencies. Most people, including myself, would have a hard time really looking at the graph above and synthesizing both amplitude and phase angle together. To solve this disconnect Howard introduced EPDR which calculates the peak (vs. RMS) current, and from that calculates what value resistor would cause that current flow. I should point out of course that while Howard brings EPDR out into the world, it is based on work originally done by E. Benjamin, "Audio Power Amplifiers for Loudspeaker Loads," JAES, Vol.42 No.9, September 1994. I don't know for sure which formula Stereophile is using but in this article and in the future I'll use:
While the paper by Benjamin is copyright, a formula itself cannot be copyrighted. Sadly I do not know if this is Benjamin or Howard's formula, but rather that it seems to be correct. I do not always come up with the same answers that Stereophile does however. My numbers are anywhere from 0.2 to 0.5 Ohms higher.
EPDR allowed a whole new look into speaker designs and lets us see under the covers a little more. Before Howard's article we were left entirely to our own listening experience to explain why some speakers were more "discerning" (a term that makes my skin crawl) of amplifiers, despite having what looked like benign speaker loads. Independent of Howard's work I had started looking at speakers like the Focal Profile 918 to attempt to understand their convoluted crossovers and lo-and-behold I discovered excess parts which made me start to think the speakers were deliberately hard to drive. I wrote about this elsewhere in more detail.
In this blog I want to show my readers what a normal speaker impedance looks like when translated to EPDR. I'm going to use my own SNR-1. A 2-way ported monitor. The SNR-1 is a good choice because it's my own design I know the crossover and know there's nothing tricky involved and also I have the complete impedance and phase data in a file, something I can't get easily from Steroephile plots. Whatever the delta is between the impedance and EPDR it comes as a result of my best efforts at crossover design with no attempt to make it any more difficult a speaker load than necessary. Perhaps the worst choice in this respect was that I picked a 4 Ohm mid-woofer instead of the 8 Ohm to get more sensitivity out of it. Otherwise, this is a boring crossover design. Let's start by examining the impedance and phase as Stereophile would have seen it before 2007:

This would be a credible 4 Ohm speaker. Meaning, if I sold this at the store, calling it a 4 Ohm speaker would be totally honest. Like Stereophile we include the phase magnitude along with the impedance.
While Stereophile has been doing an excellent job of noting where EPDR deviates from the impedance it's hard to visualize, and most audiophiles don't have a chance to consider just how a "normal" speaker like the SNR-1 looks like in pure EPDR terms, so I've created a second chart. Here we combine the normal impedance and equivalent EPDR values for the SNR-1:

As you can see, the difference with a normal, boring 2-way speaker is not major, but it does trend lower, and for a rather broad area. Between 100 Hz and 400 Hz we can see that the EPDR is around 3 Ohms. Maybe not a big deal, but if you hear softening in some frequencies with different amplifiers you now have a better idea of what is going on.
The minimum Z of the SNR-1 is 3.9 Ohms, but the minium EPDR is 2.6 Ohms.
With a normal speaker, Z and EPDR don't deviate too much. EPDR does tend to be lower but not catastrophically so. This to me is a good sign of an honest speaker design.
No comments:
Post a Comment