Friday, December 5, 2025

Equivalent Peak Dissipation Resistance for Dummies

I wrote a long article on EPDR, but realized I needed to simplify it for non technical readers. Here it is. 

SOA 

Amplifier output transistors have a safe operating area (SOA).  For power, temperature, current and voltage, these are values which must not be exceeded or else device failure will occur.  Many amplifiers incorporate circuitry to prevent this from happening.  

EPDR 

EPDR tells a speaker crossover designer how easily their speaker could exceed these values for linear amplifiers (A or A/B).  

Within the SOA of an amplifier however EPDR does not tell us how the speaker and amplifier will interact and alter the output sound.  

The speaker impedance however can be used to estimate where amplifiers may no longer produce balanced outputs and begin to "sag" due to excess current delivery. 

EPDR is not a better way to understand amplifier sag than the impedance curve.  In fact EPDR does not tell us anything about the voltage or current at the speaker terminals, so long as the SOA is not exceeded.  

Wednesday, December 3, 2025

Basics of Hard to Drive Speakers

Basics of Hard to drive Speakers

Basics of Hard to drive Speakers

Basics of Hard to Drive Speakers

While writing a blog on EPDR I realized I needed to explain what a hard to drive speaker was, and why EPDR does not really help you.

In the typical parlance of audiophiles, a hard to drive speaker is one with unusually low impedance and / or phase angles. The reason for this has to do with how voltage is divided between the amplifier’s output, and the speaker. Without using complex math, here’s the basic voltage divider formula. We’ll use R (resistance) instead of Z (impedance) to keep things simple. Let \(V_{out}\) be the amplifier’s attempted output and \(V_{spkr}\) be the voltage that actually makes it to the speaker terminals:

\[ V_{spkr} = V_{out} * \frac{R_{spkr}}{R_{amp} + R_{spkr}} \]

Consider with a very good amplifier the amplifier’s output impedance ( \(R_{amp}\) )is very low, so if \(R_{amp} = 0\) therefore \(V_{spkr} = V_{out}\) because the right side becomes equal to 1. This is ideal, and the electrical output remains constant regardless of frequency. However, as \(R_{amp}\) rises and/or \(R_{spkr}\) drops, \(V_{out}\) starts to go along with the impedance curve, which can be a roller coaster. This is why tube amps don’t do so well with electrostatic speakers and their 1 Ohm loads in the treble, or really any speaker with < 4 Ohm areas.

Here’s the fundamental problem with EPDR : None of the formulas involved address the amplifier’s output impedance, or peak current delivery or anything else related to the voltage and current at the speaker terminals. The value and derivation of EPDR is entirely about transistor heat. Howard never crosses the line to claim it isn’t about heat, but he also tries to use this understanding as another, better impedance measurement, and it can’t be. And this is where the confusion has come from. JOB’s point however that EPDR can help understand which speaker is more likely to cause an amplifier to clip is valid. How many times have you heard an amp actually disconnect due to overheating however?

Another thing to note is that an amplifier’s output impedance is the end result of the power supply, output stages and feedback design.

Damping Factor

Quickly, amplifiers rarely publish or measure output impedance, but instead publish “damping factor.” It’s calculation is \(DF = 8 / R_{amp}\)

So an amplifier with a DF of 100 has an output impedance of 0.08. Important to note that DF is usually reported in the bass but is often lower (higher R) in the treble.

Wednesday, November 26, 2025

Stereophile and Equivalent Peak Device Resistance

EPDR is Not What I thought

EPDR is Not What I thought

Author

Erik Squires

EPDR and Stereophile

This blog post is opinion, history and math. I started out as a champion of EPDR until I learned exactly what it means and how it works. The understanding in the layman audio community is that EPDR is a better way to understand how an amp may sag under normal operating conditions, and therefore alter its output, but the truth is it isn’t doing what you think it is. For more information on how hard-to-drive has been defined in the past, turn to my blog post here. However after doing the research from the original EPDR articles and the source papers from Eric Benjamin I’m convinced EPDR is being oversold and overused among us. As you’ll read, this author is very skeptical of the value of EPDR vs. how much it is used in the community and how it is interpreted. Hopefully whether you agree with me or not this paper will give you clarity from which to make up your own mind.

Conceptual Invention

In 2007 Keith Howard coined the concept of Equivalent Peak Dissipation Resistance in his article Heavy Load: How Loudspeakers Torture Amplifiers. The idea of EPDR is to help readers understand more about a speaker and how hard it is to drive. Howard writes:

But for a magazine audience, the principal interest in a loudspeaker’s load impedance lies in gaining some indication of its compatibility with a given amplifier.

The rest of the article needs very careful reading, because to many readers it sounds like he’s saying this is a better impedance measurement, but he never actually proves that. He weaves together a lot of charts, and even contradictory data from Otala:

That was left to others to check, and their results suggest that [sigh of relief] this is not a phenomenon with any practical relevance. That is what Dolby Labs’ Eric Benjamin found when he investigated the issue in 1994 (footnote 3). It’s what I found, too, when I unwittingly reprised some of Benjamin’s work in 2005 (footnote 4), albeit using a software-analysis approach rather than an oscilloscope. While in this context you can’t prove a negative—there is always the possibility that some pieces of music will contain just the waveform necessary for a particular speaker to demonstrate the Otala effect—the available evidence suggests that this probably occurs extremely rarely, if at all.

but then Howard turns the ship around, after saying this isn’t important:

No, the problem with conventional impedance measurements lies not in the measurement method itself but the way in which its results are presented.

He then goes on to use Benjamin’s work with a lot of graphs, but this part is key: He labels the charts as showing equivalent dissipation, or rather how much heat will a typical linear amplifier produce. This is not a measure of how a speaker’s output will vary but how hot the amplifier will get. The “D” in EPDR stands for dissipation. This means heat at the transistor on the amplifier.

In personal correspondence between this author and Jack Oclee-Brown (JOB) (November 24, 2025) he gives the single useful feature of EPDR:

This is the usefulness of EPDR because it tells you if one speaker is more likely to trigger Safe Operating Area protection (to clip) than another.

As a speaker designer, transforming Benjamin’s formulas into relative resistance makes it agnostic of the amplifier’s rated output power, so for JOB I can definitely see how it is useful while evaluating crossover alternatives.

Despite this being useful for a speaker designer, I want to make this point clear: EPDR is not telling us the same information about how hard to drive a speaker is vs. the raw impedance curve, and it does not tell us how the speaker will sound wiht amp A vs. amp B. It is only about how much heat the amplifier’s output devices will generate when driving that speaker, and why it may clip early. Of course, an amplifier that clips will distort and sound terrible, but that’s a different set of problems than the audiophile and speaker measurement community thinks it is. Speaking for ourselves, we thought EDPR would do a better job of explaining why some speakers sound different with different amps, but after reading the source material we now understand that is not the case. Specifically, when an amplifier “sags” or underperforms. Typically a hard to drive speaker may sound like there’s a depression in the midbass with some amps, pushing a buyer to purchase an amp with more current capbility, but EPDR does not explain this phenomenon at all, it can’t.

That is, until clipping or overheating occurs, EPDR has nothing to do with the voltage or current at the speaker terminals. It does not demonstrate additional distortion, or reduced output. The invention of EPDR appears to be showmanship, aided by a lot of pretty charts in the article, and Howard letting the casual reader come to conclusions he doesn’t actually state.

Finally, it’s important to understand that EPDR applies ONLY to linear amplifiers. It has no relevance to Class D or switching amplifiers, which are becoming more common in high-power audio applications. The entire foundation of EPDR is based on the thermal dissipation characteristics of linear amplifier output stages. This is very different from the traditional impedance metrics which matter to all amplifiers and interacts with their output impedance the same way.

Howard’s article is where the conceptual confusion starts, but the equations themselves have their own messy publication history, which is worth understanding before we talk about the math.

Messy History of the EPDR Formulas

Because neither Howard nor Stereophile ever published a formal derivation, the history of the formulas and an understanding of who is using which version come to us through a patchwork of message boards, private communication and reverse engineering. Jack Oclee-Brown (JOB) was nice enough to put together the timeline as he remembers it in a private message. I share the contents here with his permission:


  • 2007: Keith Howard comes up with EPDR and writes the Stereophile article. He derives Equation 1 but it’s not published. EPDR isn’t used by anyone for many years.
  • 2014: I [JOB] wanted to calculate EPDR and so I did my derivation and contacted Keith to confirm it matches his. It does in email correspondence. I didn’t publish, it’s not my invention and I just wanted to use it at KEF.
  • 2020 March: [Room EQ Wizard] adds EPDR calculation. JohnPM (author of REW) confirms Equation 1 is used but given the timing he can’t have used my pdf because it wasn’t public at this point
  • 2020 Aug: Stereophile start adding EPDR calculations to their reviews. There’s some interest on ASR about how to do the calc and I post my derivation just to be helpful.
  • 2021: VituixCAD adds EPDR.
  • 2025: user cjlan01 on www.diyaudio.com noticed that there’s a discrepancy between Stereophile’s published data and Equation 1 so contacts John Atkinson and finds out they’re using [the simplified version] instead. Why they did this I have no idea but Keith is not a regular writer for Stereophile and it sounds like Jim Austin came up with [the Excel] equation.

My guess is that VituixCAD uses Equation 1, it’s only Stereophile who are calculating it incorrectly I think.


Notes: I have slightly edited the exchange above for clarity and used “simplified version” to describe the Stereophile / Excel formula, below as well as added links where convenient for the reader. Also, I’ve confirmed that VituixCAD’s numbers are very close to the Howard formula, and also a little optimistic compared to the Stereophile / Excel formula.

The Formulas

With that timeline in mind, we can look at the two equations that are actually in use today: the simplified Stereophile/Excel form and the more exact Howard version.

EPDR for Stereophile / Excel

In a separate message JOB wrote to us and says:

Stereophile use Excel to calculate EPDR and use a simplified version of the formula I derived (I guess they thought that was “good enough” and certainly much easier to type into Excel).

If this is true then from cjlan01’s message the Stereophile formula is:

\[ V_{diss} = 1 + 4.2 * |\phi|/90 \] \[ EPDR = Z_{mag} / V_{diss} \] To be clear, this is a linear approximation, but Howard provides a precise answer.

EPDR by Howard

Again, we have no knowledge of Howard explicitly taking credit for any EPDR formula via an academic paper or web blog. What we believe Howard’s formula is comes to us from JOB. JOB reached out to Howard and published in his notes in a post at Audio Science Review. Looking at JOB’s PDF, Howard’s formula (Equation 1 as described in the exchange, above) slightly simplified is as follows:

\[ \text{EPDR} = \frac{|Z|}{4\, \bigl( 1 - \sin\!\left( \tfrac{5\pi}{6} + \tfrac{2}{3}|\phi| \right) \bigr) \sin\!\left( \tfrac{5\pi}{6} - \tfrac{1}{3}|\phi| \right) } \]

We’ve covered the history of the conceptual invention of EPDR and the two formulas we are aware of. This has prepared us to discuss the underlying theory from Eric Benjamin.

Eric Benjamin’s Foundation

The underlying principle of EPDR, as Howard notes, is a paper by Eric Benjamin: “Audio Power Amplifiers for Loudspeaker Loads,” JAES, Vol.42 No.9, September 1994. The paper is copyrighted and paywalled, but fortunately formulas cannot be copyrighted, so we can walk through Benjamin’s ideas. Benjamin doesn’t directly publish a formula for EPDR. That’s not actually his goal. Benjamin’s paper is about power dissipation across devices in Class B amplifiers. In other words, he wants to know how much a transistor will heat up by calculating the Watts dissipated based on the load impedance.

Safe Operating Area

The safe operating area (SOA) for a transistor has instant and average components. Exceeding the peak power for microseconds (Formula 4) can destroy a transistor, as can exceeding the average power (Formulas 6 and 7) for extended periods of time.

The point that I want my readers to understand is that Benjamin’s goal, and formulas are to calculate power dissipation in the output devices of an amplifier. He is not trying to create a new impedance measurement for speakers, and is definitely not saying “the speaker will sound different because of this.” If anything, this is about heat sinks, and cooling. Even if you barely understand formulas, the term on the left of all three formulas is \(P_{d}\), power across a device, meaning a transistor. Power across a device is power that must be dissipated or let off as heat.

Instant Power Dissipation

I don’t want to make light of Benjamin’s work, but the three Benjamin formulas (4, 6, 7) involved which Howard probably uses as a foundation would be relatively simple for an electrical engineer to derive. The real value of Benjamin’s paper is in forcing EEs to think outside of the box when designing the thermal/power envelope of linear amplifiers. We’ll start with the instantaneous device dissipation formula (4):

\[ P_{d}(\theta) = (V_{s} - V_{0} \sin \theta)\left(\frac{V_{0}}{|Z_{l}|} \sin(\theta + \phi) \right) \]

Where \(V_{s}\) is the supply voltage, \(V_{0}\) is the output voltage amplitude, \(Z_{l}\) is the load impedance, \(\phi\) is the load phase angle, and \(\theta\) is the instantaneous angle of the output waveform. It is this instantaneous value which appears to be the source for Howard’s formula.

Learning Exercise for Equivalent Resistance

This is not part of EPDR itself, but a simplified teaching example to help readers visualize how dissipation-based equivalence works. We want to illustrate the concept of an equivalent resistance without the calculus Howard and JOB went through. We call this Equivalent Average Dissipation Resistance. The idea here is to give the reader with basic circuit theory a conceptual leg to stand on.

Let’s be clear of the concept and goal. We want to know the value for a resistor that would dissipate the same average power as the complex load. In other words, what value of \(R_{eq}\) would dissipate the same power as our complex load \(Z_{l}\) with phase angle \(\phi\) ? For instance, if we had a complex load of 4 Ohms at -45 degrees, what value of resistor would dissipate the same average power as that load when driven by the same voltage source? The resistor by definition would have a phase angle of 0, and therefore must be lower than 4 Ohms.

The calculation requires a two-step process. First we calculate a token voltage which will yield a token value for power dissipated given the load, and phase angle. Given power and voltage we then calculate the resistance. I say token because for our case, we don’t actually care about actual device power (\(P_{d}\)), we care about what would be equivalent resistance. So whether we calculate in the range of 0 to 1 watt, or thousands of watts, it doesn’t matter because we’re not actually sizing heat sinks.

Average Power Dissipation

Benjamin integrates his instantaneous formula (4, above) over the input signal’s conduction angle to get average power dissipation (formula 6 and 7, below). The end results are two formulas for power dissipation based on phase angle of the load, one for phase angles less than 50 degrees (6), and one for phase angles greater than 50 degrees (7).

Formula 6 if \(|\phi| \leq 50^\circ\) then:

\[ P_{d} = \frac{2 V_{ss}^{2}}{\pi^{2} |Z| \cos\phi} \]

Formula 7 if \(|\phi| > 50^\circ\) then:

\[ P_{d} = \frac{V_{ss}^{2}}{2|Z_{mag}|} * \left(\frac{4}{\pi} - \cos(\phi) \right) \]

Equivalent Resistance for Average Power

Then we set this equal to the power dissipated by a resistive load:

\[ \text{EADR} = \frac{2V^{2}}{\pi^{2} * P_{d}} \]

For our use, the exact value for V doesn’t matter. Set it to 10 or any other positive constant for all your calculations. Below is the R code which expresses Benjamin’s two formulas and our own EPDR calculator. Hopefully they will help you translate to your language of choice or even a spreadsheet.

# Benjamin's device dissipation formula. 
# This is written for easier use with vectors in R 
dev_power <- function (Zmag, phase_deg, V=10) {
  phi <- abs(phase_deg) * pi / 180
  
  # Go ahead and calculate both formulas, 6 and 7
  P6 <- (2 * V^2) / (pi^2 * Zmag * cos(phi))
  P7 <- (V^2 / (2*Zmag)) * ((4/pi) - cos(phi))

  # Return either P6 or P7 based on phase angle
  ifelse(abs(phase_deg) < 50, P6, P7)
}

# Calculate EADR
eadr_from_dev_power <- function(Zmag, phase_deg, V=10) {
  # Calculate some sample power dissipation
  P <- dev_power(Zmag, phase_deg)
  
  # Now we calculate what resistor would give the equivalent as returned, above
  EADR <- 2 * V^2 / (pi^2 * P)
  return(EADR)
}

We hope this exercise has helped you understand the concept of equivalent resistance in this context, though we have no idea if anyone will ever use this in real life.

Conclusion

We’ve walked through the publicly available sources (and sometimes not so public) for how Equivalent Peak Dissipation Resistance came into existence. We’ve shown the original research was intended to help amplifier designers understand how much heat their output devices would generate when driving complex speaker loads. We’ve discussed how Howard’s article puts EPDR adjacent to impedance and phase angle charts, but never actually proves that EPDR is a better way to understand amplifier/speaker matching in terms of sound quality.

While we have shown why we believe Stereophile and Howard’s formulas differ, we have no evidence that any version of EPDR is a better way to examine amplifier/speaker matching than the old impedance and phase angle charts. None of the derivations or formulas have anything to do with how a speaker sounds, or how well an amplifier can drive a speaker. As far as we can tell EPDR and the formulas from which it is derived have nothing to do with voltage or current across a speaker input. At the very best, EPDR can help understand which speaker is more likely to cause an amplifier to enter protective shutdown due to activation of SOA circuits, if any.

In addition, if we were designing amplifiers I would want to know the power output (Benjamin formulas 4, 6 and 7) directly instead of an equivalent resistance, which is why the entire concept of equivalent resistance in this field seems of limited use.

To paraphrase JOB’s point: EPDR may give a speaker designer some idea of the kind of amplifier needed to drive a speaker at full output. Below that, at moderate listening levels and power outputs EPDR doesn’t really give a consumer very much.

Sunday, November 23, 2025

Speaker Impedance vs. Equivalent Dissipation

Please note that this article is superseded by more research done here: Stereophile and Equivalent Peak Dissipation Resistance.  

We leave the original article below for history, and due to existing links, but we encourage you to read the article, above, first. 

What follows below was naive and needed more research.  In particular, I no longer believe EPDR helps the average audiophile do anything. 

Original article:  

Anyone who has spent time looking at Stereophile speaker reviews has become familiar with speaker phase and amplitude plots.  The idea behind showing a reader this is to let them know how difficult any given speaker might be to drive.  Whether a lightweight amp or big honking monoblock will be needed.  

Here's an Example of a very well behaved 2-way speaker from Totem Acoustics

 118TotS1fig1.jpg

We  can see the impedance never drops below 7 Ohms and the phase angle is for the most part pretty well behaved. 

In 2007 Stereophile writer Keith Howard introduced the concept of Equivalent Peak Dissipation Resistance (EPDR).   EPDR is a little convoluted.  The goal is to mathematically combine phase angle and impedance to come up with a new number expressing how hard the speaker will really be for an amplifier to maintain a consistent output across all frequencies.  Most people, including myself, would have a hard time really looking at the  graph above and synthesizing both amplitude and phase angle together. To solve this disconnect Howard introduced EPDR which calculates the peak (vs. RMS) current, and from that calculates what value resistor would cause that current flow.   I should point out of course that while Howard brings EPDR out into the world, it is based on work originally done by  E. Benjamin, "Audio Power Amplifiers for Loudspeaker Loads," JAES, Vol.42 No.9, September 1994.  I don't know for sure which formula Stereophile is using but in this article and in the future I'll use: 

1763931679983.png 

While the paper by Benjamin is copyright, a formula itself cannot be copyrighted. Sadly I do not know if this is Benjamin or Howard's formula, but rather that it seems to be correct. I do not always come up with the same answers that Stereophile does however.  My numbers are anywhere from 0.2 to 0.5 Ohms higher.   

EPDR allowed a whole new look into speaker designs and lets us see under the covers a little more.  Before Howard's article we were left entirely to our own listening experience to explain why some speakers were more "discerning" (a term that makes my skin crawl) of amplifiers, despite having what looked like benign speaker loads.  Independent of Howard's work I had started looking at speakers like the Focal Profile 918 to attempt to understand their convoluted crossovers and lo-and-behold I discovered excess parts which made me start to think the speakers were deliberately hard to drive.  I wrote about this elsewhere in more detail.

In this blog I want to show my readers what a normal speaker impedance looks like when translated to EPDR.  I'm going to use my own SNR-1.  A 2-way ported monitor.  The SNR-1 is a good choice because it's my own design I know the crossover and know there's nothing tricky involved and also I have the complete impedance and phase data in a file, something I can't get easily from Steroephile plots.  Whatever the delta is between the impedance and EPDR it comes as a result of my best efforts at crossover design with no attempt to make it any more difficult a speaker load than necessary.  Perhaps the worst choice in this respect was that I picked a 4 Ohm mid-woofer instead of the 8 Ohm to get more sensitivity out of it.   Otherwise, this is a boring crossover design.  Let's start by examining the impedance and phase as Stereophile would have seen it before 2007: 


This would be a credible 4 Ohm speaker.  Meaning, if I sold this at the store, calling it a 4 Ohm speaker would be totally honest.   Like Stereophile we include the phase magnitude along with the impedance.  

While Stereophile has been doing an excellent job of noting where EPDR deviates from the impedance it's hard to visualize, and most audiophiles don't have a chance to consider just how a "normal" speaker like the SNR-1 looks like in pure EPDR terms, so I've created a second chart.  Here we combine the normal impedance and equivalent EPDR values for the SNR-1:


As you can see, the difference with a normal, boring 2-way speaker is not major, but it does trend lower, and for a rather broad area.  Between 100 Hz and 400 Hz we can see that the EPDR is around 3 Ohms.  Maybe not a big deal, but if you hear softening in some frequencies with different amplifiers you now have a better idea of what is going on.  

The minimum Z of the SNR-1 is  3.9 Ohms, but the minium EPDR is 2.6 Ohms. 

With a normal speaker, Z and EPDR don't deviate too much.  EPDR does tend to be lower but not catastrophically so.  This to me is a good sign of an honest speaker design.  

Monday, November 10, 2025

RoonBridge Pi 5 Ubuntu 24 HDMI

Here's a fix that maybe 4 other people on earth will need.  I had this happen on Ubuntu 24.10, but it's quite possible if you attempt to install Roonbridge on 24.04 (LTS) you'll have the same issues, depending on exactly when you reboot.  To be honest, I'm not 100% sure of why the problem occurs.  I think it's a timing/race condition, but it could also just be bad code. The instructions below should fix things either way. 

Requirements: Ubuntu 24.x, RoonBridge 1.8 (build 1124 stable) and a Raspberry Pi 5. 

Symptoms:  After following installation instructions for RoonBridge playback via HDMI will cause Roon to skip through several tracks before saying "Too many errors." 

Cause: 

The issue has to do with the device description strings RAATServer caches in /var/roon/RAATServer/Settings.  Since a Pi 5 has 2 HDMI ports, you'll find at least 2 JSON files here named device_(some big string).json.  If you have a USB device connected you may find more, so be careful your files are HDMI related before editing.  In Ubuntu 24 you'll see the string vc4hdmi, which is how you can tell you aren't editing the wrong kind of file.  In any event, it's a simple edit once you know what the issue is.  

Here's the first version of my JSON:

 {"unique_id": "617c2b7a-8bf6-18d6-0243-1e918a7e673c", "external_config": {}, "output": {"name": "vc4-hdmi-1", "type": "alsa", "device": "hw:CARD=vc4hdmi1,DEV=0", "dsd_mode": "none"}, "volume": {"type": "alsa", "device": "hw:CARD=vc4hdmi1,DEV=0"}} 

The problem is the device name should be hdmi:CARD....  As I mentioned, in some cases this may already be correct and you don't need to change a thing. 

Fix: 

Make sure you have rebooted at least once after ALSA library installation.  

Just replace the hw: string highlighted above with hdmi: and you'll be playing 32 bit music through your HDMI port.  Here's a finished version: 

 {"unique_id": "617c2b7a-8bf6-18d6-0243-1e918a7e673c", "external_config": {}, "output": {"name": "vc4-hdmi-1", "type": "alsa", "device": "hdmi:CARD=vc4hdmi1,DEV=0", "dsd_mode": "none"}, "volume": {"type": "alsa", "device": "hdmi:CARD=vc4hdmi1,DEV=0"}}

  After these edits:

sudo systemctl restart roonbridge 

What happened: 

hw:CARD is the raw device name but hdmi:CARD is the ALSA virtual device.  The big issue is that RAATServer talks PCM but the raw device does not.  The raw device only talks IEC958.  In order to talk PCM (S16_LE, S24_LE, etc.) through HDMI the RAATServer should use the virtual device which has the built in PCM to IEC958 translation goodness. 

Since you have 2 HDMI devices you might as well fix both files now.   Once you make these changes you'll notice the Roon DSP features like upsampling become available. 

Why it happened: 

This is an error during RoonBridge installation storing the raw device name instead of the virtual device name.   It may be a race condition during installation, in the period between when the virtual devices get instantiated by the kernel and the RoonBridge scans the hardware or it could be bad installation code.  It's possible the "fix" is a change to the installation instructions, to explicitly reboot after installing ALSA but before installing RoonBridge.  I'll leave that up to Roon.

Alternative Installation Guide

As mentioned, a possible solution to this when installing a fresh Ubuntu 24 is to apt install alsa  and then do a reboot BEFORE installing RoonBridge.

The theory why this might work is that just installing ALSA doesn't instantiate the virtual devices.  That is, after apt install alsa the hdmi:CARD devies don't exist yet, because those get created each time the kernel starts up and not when the library is installed.  By rebooting post-ALSA installation the hdmi:CARD virtual devices should exist and therefore, hopefully, the RoonBridge install will see them.  If not, go through the steps above.   Note that this only works during installation.  What I do know is that once the device files are bad reboots alone won't fix the issue.

It's quite possible a number of Pi 5/Ubuntu/Roon users accidentally did this right, or somehow installed ALSA, rebooted and perhaps re-installed Roonbridge from scratch.  So for those people this bug wouldn't occur.   On the other hand, if you are trying to quickly stand up a minimum installation you really might not have.  In my case I rebooted after a full upgrade but before the ALSA libraries  were installed, so I suspect that's what kept things from working correctly. 

Future Proofing

As mentioned or implied, above, I'm not sure when these files get crated or recreated, but to be sure the hdmi:CARD devices exist before RoonBridge starts you'll need to add  an override to the RoonBridge service.   There seems to be a difference in the startup sequence between Ubuntu 24.04 and 24.10 so this may be particularly important in 24.10.  In any event, better safe than sorry.  Let's force RoonBridge to wait for audio and networking to be done before starting.  This way any future rewriting of these files by RoonBridge should hopefully happen in the right order. 

First:  

sudo systemctl edit roonbridge 

Add these lines: 

[Unit]
Description=RoonBridge
After=sound.target
After=network-online.target


Save and reboot.   This will ensure that RoonBridge always starts after sound.target and the network is on.  Hopefully then that means that future installations or updates will only recreate those JSON device files correctly.  Who knows, this may also solve issues about USB DACs being discovered by RoonBridge or not after a reboot.

You are welcome.  

Monday, October 27, 2025

Discerning or Hard to Drive Speakers

Speaker impedance is a complicated subject, but it is well known that some speakers are harder to drive than others.  Sometimes there is a legitimate reason for this and sometimes a difficult impedance curve appears to be a marketing gimmick.   We'll cover the basics of impedance curves, but what I want you to keep in mind is that a decent crossover designer CAN make an impedance much worse than it should be.  A bad crossover designer can achieve the same.

I want to emphasize, that in some cases you can make the speaker much harder to drive, without changing the speaker's frequency response with an ideal voltage source.   By doing so you have artificially created a speaker that is "highly discerning" of amplifiers specifically because amplifiers are not ideal voltage sources.  They have limits based on the size of the power supply and output stage capacity, as well as use of feedback. 

No two speaker models have the same impedance curve, the lower the impedance, and wider the "phase angle" the harder they are to drive.  Phase angle means whether the voltage leads (inductive) or lags (capacitive) the voltage across a device.   

A "hard to drive" speaker requires an amplifier with more current, and these amplifiers are usually more expensive than you would need for an "easy load."  

The Physics

An impedance curve is a measure of the impedance of a loudspeaker at a variety of frequencies.  In the worst  case this curve will interact with the amplifier, causing the output frequency response to "track" or mimic  the impedance curve.  Where the impedance is high, the output is high, where it's low the output is low.  The published frequency response measurements in Stereophile are always conditional on the amplifier being well in it's comfort zone. 
 
This is essentially the common limiting factor of tube amps (yeah, not ALL tube amps) and why some speaker makers like Fritz go out of their way to produce speakers which are easy to drive across their entire range.
 

The Gimmick

Many audiophiles unfortunately believe that a speaker that shows the difference between upstream components is more musical or easy to listen to.  They are not.  They just show differences better, but these buyers will prefer the speaker that is harder to drive, and then buy a bigger amplifier.  

The way this gimmick works is that a buyer, hopefully a well-heeled audiophile, is tricked into buying speaker A instead of B because they believe it to be more "discerning."  When you use a $1,000 amp and then swap it for a $30,000, 200 lb gorilla of an amp the speaker suddenly comes alive.  Clearly, this speaker can hear all the great improvements between the first amp and the second, and therefore, the "discerning" speaker is going to reveal more about the music than any other.  This also justifies buying monoblock amplifiers when you'd otherwise be happy with a small integrated had you picked an easier to drive speaker.

A speaker that is hard to drive causes a softening of output where the impedance is low.  For instance, with an ESL tube amps often sound dull, and lacking treble. Swap to a nice solid-state and they bloom.  Even a speaker with a mid-bass around 3 Ohms that is otherwise clean may make current delivery audible. 

To be clear, there is absolutely no proof that a "discerning" speaker is actually better at playing real music, so this false logic is part of the whole inference chain.  

Just like with romantic partners, a high-maintenance partner is just a high-maintenance partner, that doesn't make them smarter, funnier or more responsible at picking up the kids every day.  

The Bad

Some speakers are by the nature of their physics never going to be an easy load.  Two quick examples are electrostatics like Sanders or Martin Logan or the legendary Apogee Scintilla.   Electrostatic panels are essentially constructed like giant capacitors, so a 1/3 Ohm at the high frequency is not uncommon. 

The Apogee Scintilla, for instance, was essentially, a giant fuse, with a typical impedance around 1.4 Ohm as a result, and these speakers made Krell's amplifiers famous as they were some of the only amps capable of driving them.  A 50 Watt/channel Class A amplifier would deliver 400 Watts into each of them at 1 Ohm.  Fortunately later models were more reasonable around  3 Ohms. 

Sometimes designers do pull more current for more volume, but these are still typically well managed by most amps.  For instance, using 3 woofers in a single loudspeaker can lower the impedance.  Also, we often can pick 4 or 8 Ohm woofers and may pick to get better matching to a mid or tweeter.  The 4 Ohm version will play 3 dB louder thanks to the current doubling.


The Ugly 

There are three loudspeakers I want to show you as example of really questionable impedance curves.  To be clear, without taking a speaker apart it is impossible to know for sure what is going on under the hood, or whether this is an intentional "juicing" of the curve or a natural by product of good crossover design. 

The speakers are:

 Ages ago I did a complete electrical tear down of the Focals.  What I found really disappointed me at the time.  I found a bank of resistors and caps which appeared to be there deliberately to lower the impedance.  Before we dive in lets look at a typical ported  speaker impedance curve. 

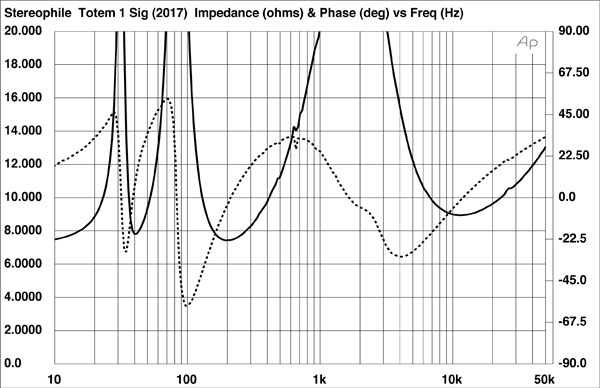
Here's an example of my own, the SNR-1, but almost ANY speaker in Stereophile with a port will be similar:


On the left are the typical dual impedance humps.  On the right is the impedance hump caused by the midwoofer to tweeter crossover.    The dual port and driver humps are expected and completely benign except for the weakest of amps.  

 Now that we know that, lets examine the speakers in order.  First the Focal Profile 918.  I actually simulated an alternate crossover for this speaker.  


The green curve is the original.  The second port resonance has almost vanished, and impedance remains under 4 Ohms  from 40 to 400 Hz.    At 95 Hz the impedance is about 2.3 Ohms.  A punishing impedance for many amps, and also completely unnecessary.  

The blue line is the simulated crossover improvement.  The second hump is restored with much better impedance below about 150 Hz.  For our three sample speakers this is the only one I have a schematic for.  


Notice the capacitor and resistor banks?  Completely unnecessary.  You greatly improve the impedance just by removing C2, and with an inductor change can remove the second bank of resistors.  These resistors are basically just here to steal power and heat up the interior of the speaker cabinet. Good thing it has a big port on the bottom! 

Now that we have at least one good example of how impedance curves can be juiced or altered by a crossover designer I want to turn to a modern and not so modern example which might have similar issues. 


KEF Reference 1 Meta

Important Update:  Since publishing this paper I've done a deep dive into the source and meaning of EPDR.  I no longer think it carries as much weight as it should for determining hard to drive speakers.  The missing hump information, and how it matches what the Focal Profiles does is still valid.   It may turn out that the 1 Ohm EPDR for the KEF speakers is no longer truly valid or important. 
 
 
The second speaker to cross my radar for possibly being deliberately demanding is the KEF Reference 1 Meta.  

This bookshelf speaker was released sometime around 2022 and we benefit greatly by a full write up from Erin's Audio Corner.   While Erin does note this is a very difficult to drive speaker due to a very low Equivalent Peak Dissipation Resistance (EPDR) of around 1 Ohm neither he nor any other widely published reviewer (which I'm not) mentions how odd the impedance curve is for a ported speaker.   


Notice that like the Focal, the expected second hump is missing.   We could ask "isn't this just an impedance flattening circuit? " Well, if it is then the fix is worse than the problem.

Revel Salon Ultima 2

While the Focal and KEF have been on the back of my mind for a while, it was over at DIY audio that the Revel and an important anecdote crossed my vision.  User cyclotronguy asserts: 

According to the Harmon engineers, they had specifically designed a loudspeaker that while it looked easy to drive on-paper , in fact was quite reactive and demanding so as to showcase the high wattage ML amps they were about to market.  


And it was that story, along with the impedance curve where it all clicked:


A very similar signature as the KEF.  Missing second hump, and hard to drive. 

Conclusion

I can't prove intention in any of these designs.  It is not wrong to say that these speakers are all going to be "discerning" of amplifiers because anything other than top level amps will wither under the stress. 

I can say that I don't know of a normal way the Focal speaker designers get to that schematic, or the KEF or Revel speakers end up missing a driver resonance hump.   My advice to any audiophile reading this though is to please, consider if you really want a "discerning" speaker, or one that's easy to live with.   It is my conclusion that in most cases you are going to enjoy more music more clearly and for less total cost of ownership with a less demanding speaker of the same type. 
 
I'm definitely not saying you should not by an ESL.  If that's what you want, go get it. I'm saying if you are deciding between a pair of dynamic speakers, please don't be tricked by this gimmick.   

Wednesday, September 17, 2025

Powering Woofer Mark I


 The front view of the Mark I.  The original SNR-1 is on top.  The twin 10" aluminum woofers sit underneath.  

Below is the rear view, showing the tweeter and mid-woofer connections on the back of the PW-1's cabinet.   Note that the bottom section has a 3-way Class D amplifier.  The speaker jacks on the bottom cabinet are amplifier outputs.   

 The SNR-1 were originally intended to be passive speakers but with an external crossover.  In this case, the removal of the external crossover and connection to the PW-I was trivial. 

The drivers are Dayton Audio RSS265HF-8.  They are 10" aluminum and in this sealed cabinet would do 40 Hz alone.  I had the choice of doing 1 10" woofer, ported to get to ~ 25 Hz, or 2 sealed and I went with sealed for the higher output, lower distortion, and lower group delay.  It did need a little boost in the DSP, but I have so much output available in my modest living room this was trivial.  Also, since this is now tri-amped I can afford to give the bass more power and still have another 250W for the mid and 100W for the treble. 


Here's a beauty shot of the woofers.